High-speed ADCs can generate enormous amounts of data, but capturing that data reliably is where the real FPGA work begins.
In this project, the Neutron KU60 FPGA Board is interfaced with the TI ADS54J69 EVM to build a dual-channel JESD204C-based data acquisition system. The ADS54J69 captures two analog inputs and delivers the digitized samples to the KU60 through a 2-lane JESD204C link.
The FPGA receives the high-speed serial data, reconstructs the ADC samples through the JESD204C PHY and receiver, performs transport-layer demapping, formats the samples into an AXI4-Stream, and uses AXI DMA to store them in DDR memory.
From there, the Vitis application transfers the captured data to a PC over Ethernet, where a Python application displays the two-channel waveforms and extracts useful measurements such as frequency and peak-to-peak voltage.
This blog walks through the complete implementation—from ADC configuration and JESD204C bring-up to FPGA data movement, DDR capture, Ethernet transfer, and PC-side visualization.
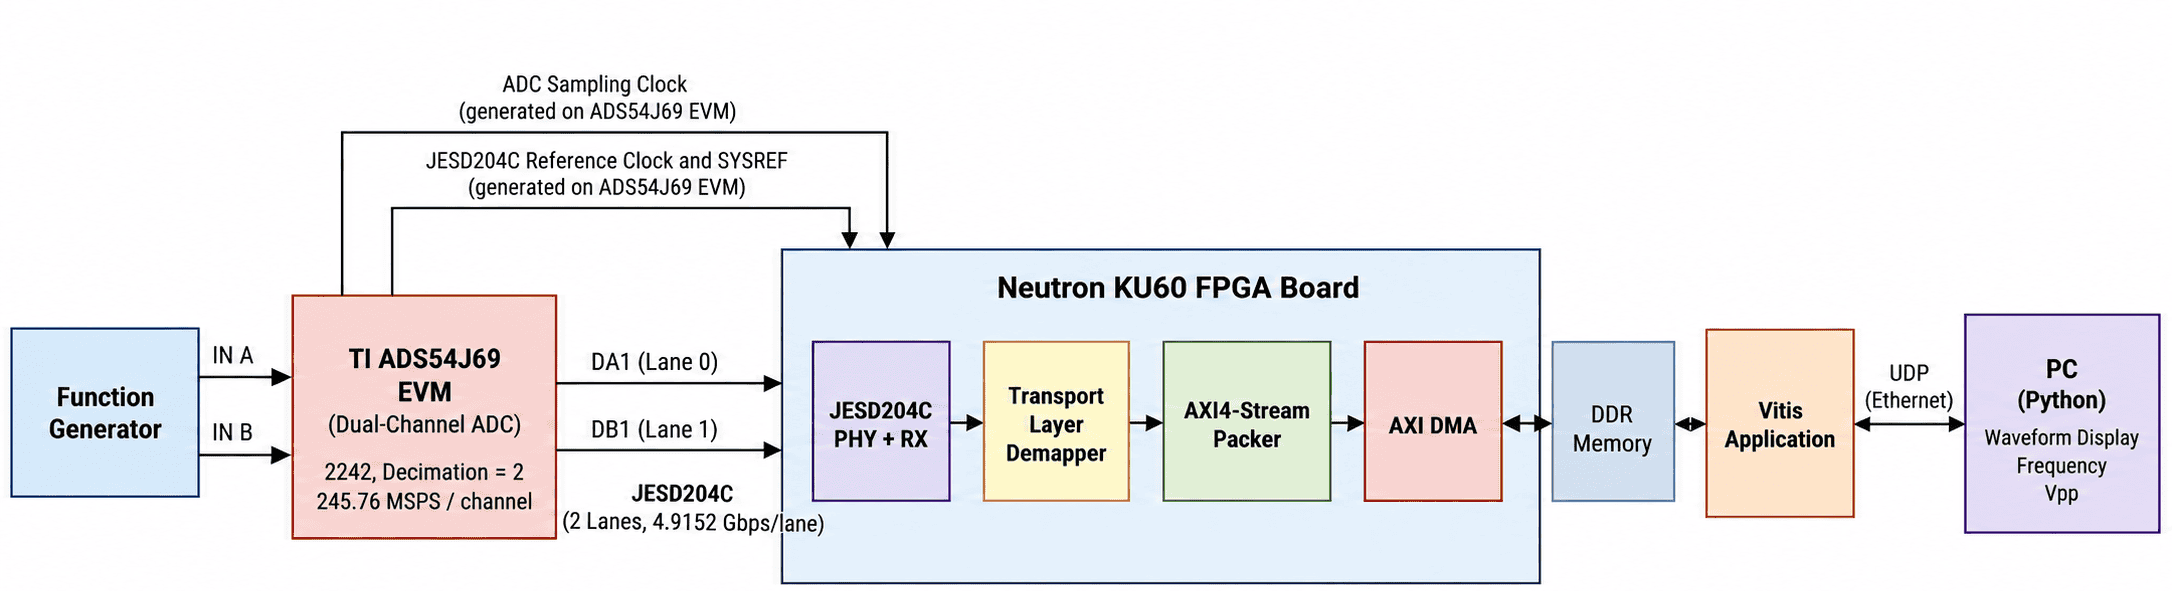
Analog Signals → ADS54J69 EVM → JESD204C → Neutron KU60 FPGA → JESD204C PHY/RX → Transport Layer Demapper → AXI4-Stream Packer → AXI DMA → DDR → Vitis → UDP/Ethernet → Python Waveform Viewer
Let’s get into how the ADS54J69 and Neutron KU60 FPGA work together to convert high-speed analog signals into real-time digital waveforms.
What This Demo Shows
This project demonstrates how the Neutron KU60 FPGA board can be used as a high-speed dual-channel FPGA-based data acquisition platform. In this demo, the board:
- Interfaces with the Texas Instruments ADS54J69 EVM for high-speed dual-channel analog-to-digital conversion
- Captures the ADC data through the JESD204C interface using the FPGA programmable logic
- Receives two JESD204C lanes corresponding to the two ADC channels
- Processes and reconstructs the ADC samples using a dedicated transport-layer demapper
- Formats the dual-channel samples through an AXI4-Stream data path
- Uses AXI DMA to transfer the captured ADC data into DDR memory
- Runs a Vitis application to process the captured data
- Transfers the ADC data to a PC through UDP over Ethernet
- Uses a Python-based waveform viewer for real-time visualization
- Displays the measured frequency and Vpp of the captured signals
The result?
A complete high-speed dual-channel ADC acquisition system running on the Neutron KU60 FPGA board, taking analog signals at the ADS54J69 inputs, capturing and processing them through the FPGA’s JESD204C interface, storing the samples in DDR, and transferring the data over Ethernet for real-time waveform, frequency, and Vpp visualization on a PC.
Hardware Setup
The first step is to establish the physical connections between the ADS54J69 EVM, Neutron KU60 FPGA Board, function generator, and the PC.
Connecting the ADS54J69 EVM to the Neutron KU60 FPGA Board
Make the following connections:
- Connect the 5 V power adapter to the ADS54J69 EVM.
- Connect a USB Micro-B cable from the ADS54J69 EVM to the PC. This connection is used to configure and control the ADC EVM through the TI configuration tool.
- Connect the Function Generator outputs to the ADC inputs on the ADS54J69 EVM using SMA-to-BNC cables. Connect the two generator outputs by setting whatever input signal you want to plot to the corresponding Channel A and Channel B inputs.
- Connect the 12 V power adapter to the Neutron KU60 FPGA Board.
- Connect a USB Type-C cable from the Neutron KU60 FPGA Board to the PC for FPGA programming and debugging.
- Connect a Cat 6 Ethernet cable between the Neutron KU60 FPGA Board and the PC for transferring the captured ADC data.
The complete hardware setup provides the following signal and data path:
Function Generator → ADS54J69 EVM → JESD204C → Neutron KU60 FPGA Board → Ethernet → PC
Running the Project
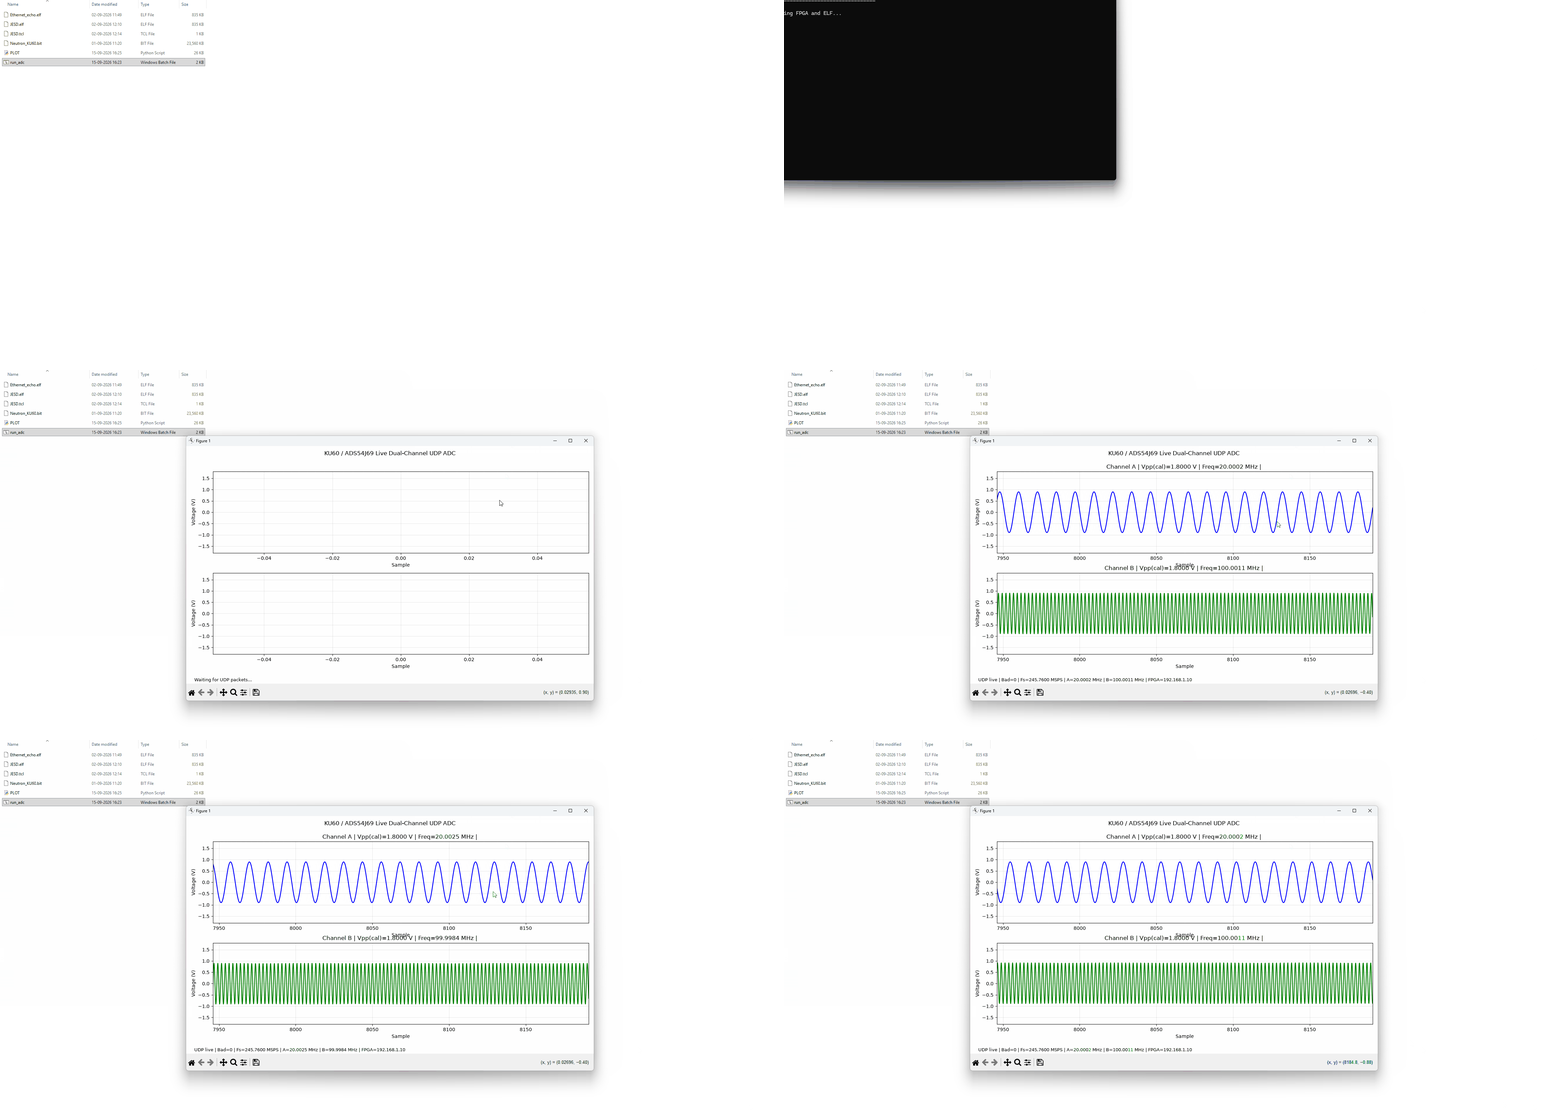
After completing all the required connections and configurations, download the batch file from here, update the Vitis XSDB path as required, and run the run_adc batch file. The waveform will then be plotted automatically.